
If you’re wondering why your WordPress site is slow, open the page a customer needs most on your phone. For a restaurant, that might be the menu. For a shop, it might be a product page. Notice when you’re left waiting. A blank screen, a late photo and a Reserve button that takes a second to react each give you a different place to start.
| What you notice | Where to start |
|---|---|
| The screen stays blank | Check how long the server takes to send the page. |
| The page appears, then the big photo shows up late | Check the main image’s file size and when it starts downloading. |
| Text appears late or rewraps | Check which fonts load and how different the fallback looks. |
| The page looks ready, but a tap takes a while | Test the button and check scripts or embedded widgets. |
| A button moves right as you tap it | Look for a late banner, image or embed that pushes it down. |
How to run a mobile speed test
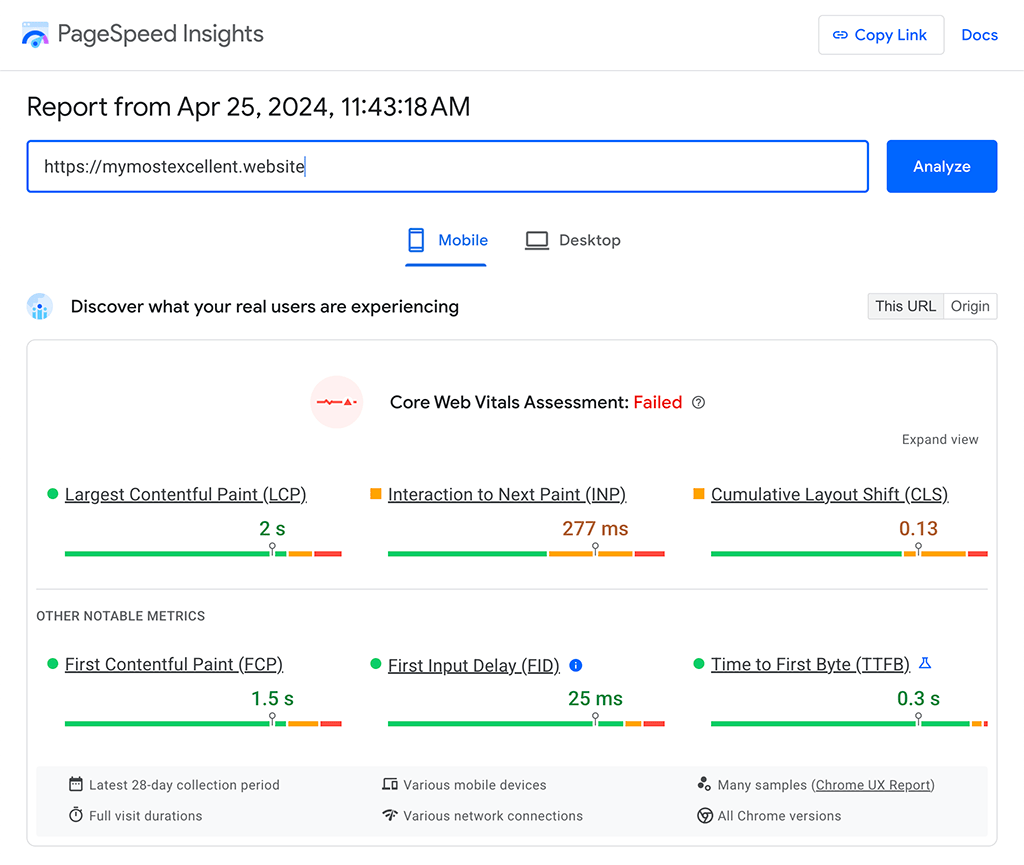
Run the mobile report in PageSpeed Insights for your homepage and one page people rely on. Then open that second page on your phone while signed out and try the action it’s built for. If a booking popup stalls after you tap it, write down the exact button and what you observed. You’ll need that detail when you retest.
PageSpeed Insights shows real visitor data when enough is available. Check whether it’s reporting on the exact URL or the whole site. Use the simulated lab test to investigate the page you submitted. If visitor data is unavailable, keep the lab result as a baseline and record what happens on your phone.
The Core Web Vitals measure how soon the main content appears (LCP), how quickly the page responds to interactions (INP), and how much the layout unexpectedly moves (CLS). The “good” thresholds are 2.5 seconds, 200 milliseconds and 0.1 respectively, evaluated at the 75th percentile of visits. Search Console can help you spot groups of URLs with recurring problems.
Free page speed testers
- Google PageSpeed Insights is where I’d start with a public URL. Check the mobile report for real visitor data when available and the lab report for clues about that page.
- DebugBear’s free website speed test helps you see when individual images, fonts and scripts start loading. Use it if you want to find what held up the page.
- Lighthouse in Chrome DevTools lets you test a page from your own browser, including a staging page you’re signed in to.
1. The server is slow before the page begins
What you’ll notice. The screen stays blank before the page starts to appear.
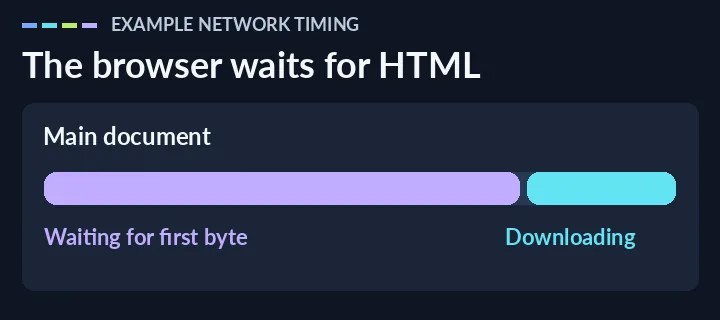
What to check. In your browser’s Network panel, reload while signed out. Select the first document request, then look under Timing for the wait before the response starts. This is time to first byte (TTFB). It includes network time and server work.
What to try. If the wait is consistently long, send your host the page URL and test times. Ask whether the page was served from cache and whether PHP workers or database queries were busy.
2. Your hero image is too large
What you’ll notice. The headline shows up quickly, but the main photo takes another moment.
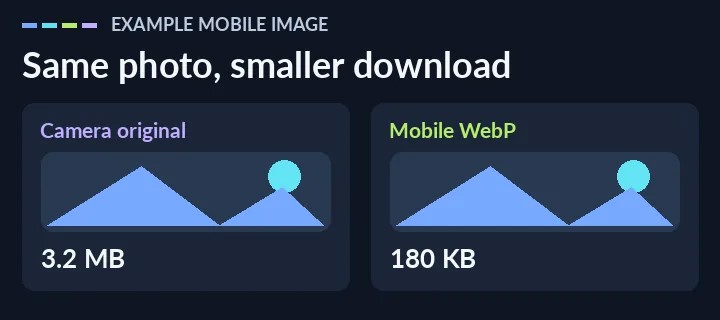
What to check. In the mobile speed report, check whether the photo is the Largest Contentful Paint (LCP) element. Compare the image file the phone downloads with the size it actually needs.
What to try. Serve a smaller responsive image, try WebP or AVIF, and set the image’s width and height. If the photo is the LCP image at the top of the page, keep it out of lazy loading and retest.
3. Fonts arrive too late
What you’ll notice. The headline appears late or breaks onto another line as the page loads.
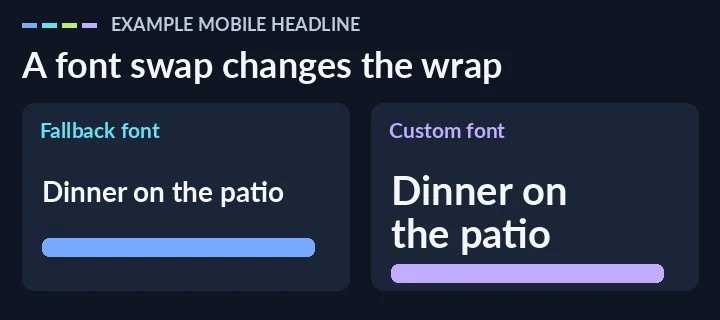
What to check. In the Network panel, filter for Font and reload. Look for families and weights the page requests but never uses.
What to try. Choose a fallback font with similar proportions, and use a font-display setting that keeps text readable while the custom font loads. Retest headlines and button labels on a narrow screen.
4. Plugins load code everywhere
What you’ll notice. A plugin adds a feature to one page, but its files show up on other pages too.
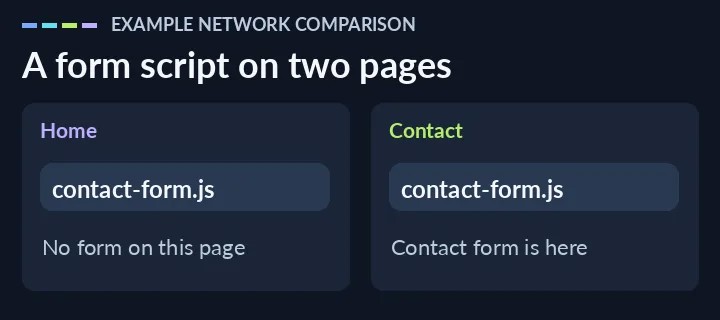
What to check. In the Network panel, compare JavaScript and CSS requests on the homepage and the Contact page. Look for the form plugin’s files on pages with no form.
What to try. Check whether the plugin can load its files only where the feature is used. Make the change on staging and submit a test form before rolling it out.
5. JavaScript blocks interactions
What you’ll notice. The page looks ready, but opening the menu or tapping Reserve takes a moment.
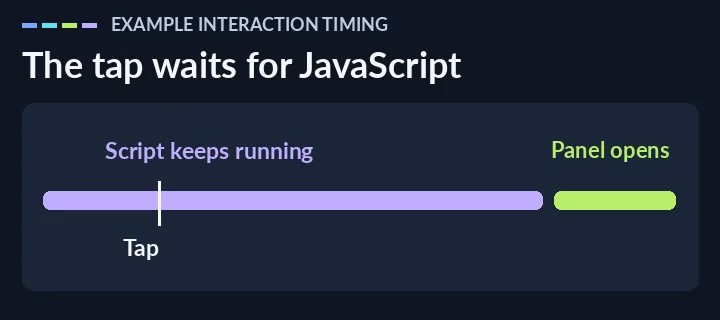
What to check. Record the tap in Chrome’s Performance panel. Look for a long task around the interaction, then check which script was running when you tapped.
What to try. Start with optional widgets. You might load a reservation embed when the booking panel opens. Retest the whole flow with touch and keyboard, and keep dependent scripts in order.
6. Caching is incomplete or incorrectly configured
What you’ll notice. You update the lunch menu in WordPress, but guests still see yesterday’s price.
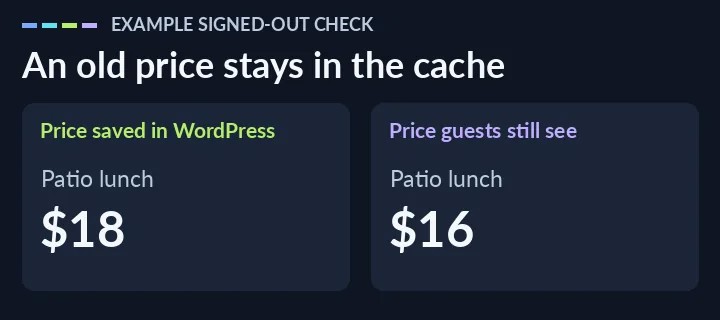
What to check. After a public-page update, reload while signed out. If the old content persists, check whether the host’s page cache refreshed. Page caching serves saved HTML, object caching saves repeated application work, and a CDN can deliver files closer to visitors.
What to try. Find out which tool owns the page-cache rules before changing settings. Keep carts, checkout and account pages outside the shared cache.
7. Elements jump around as the page loads
What you’ll notice. A late banner pushes a button down just as you’re about to tap it.
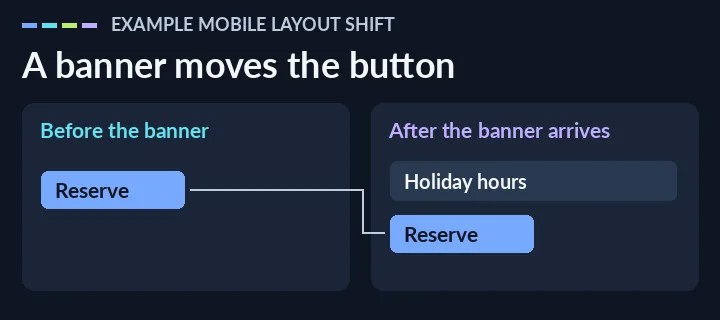
What to check. Reload on a phone and watch the space around the main button. To pinpoint the movement, check the Layout Shifts track in Chrome’s Performance panel. Unexpected movement contributes to Cumulative Layout Shift (CLS).
What to try. Reserve space for images, embeds and banners before they load. Check a narrow screen to confirm the button stays where readers expect it.
A WordPress example: fonts without extra guesswork
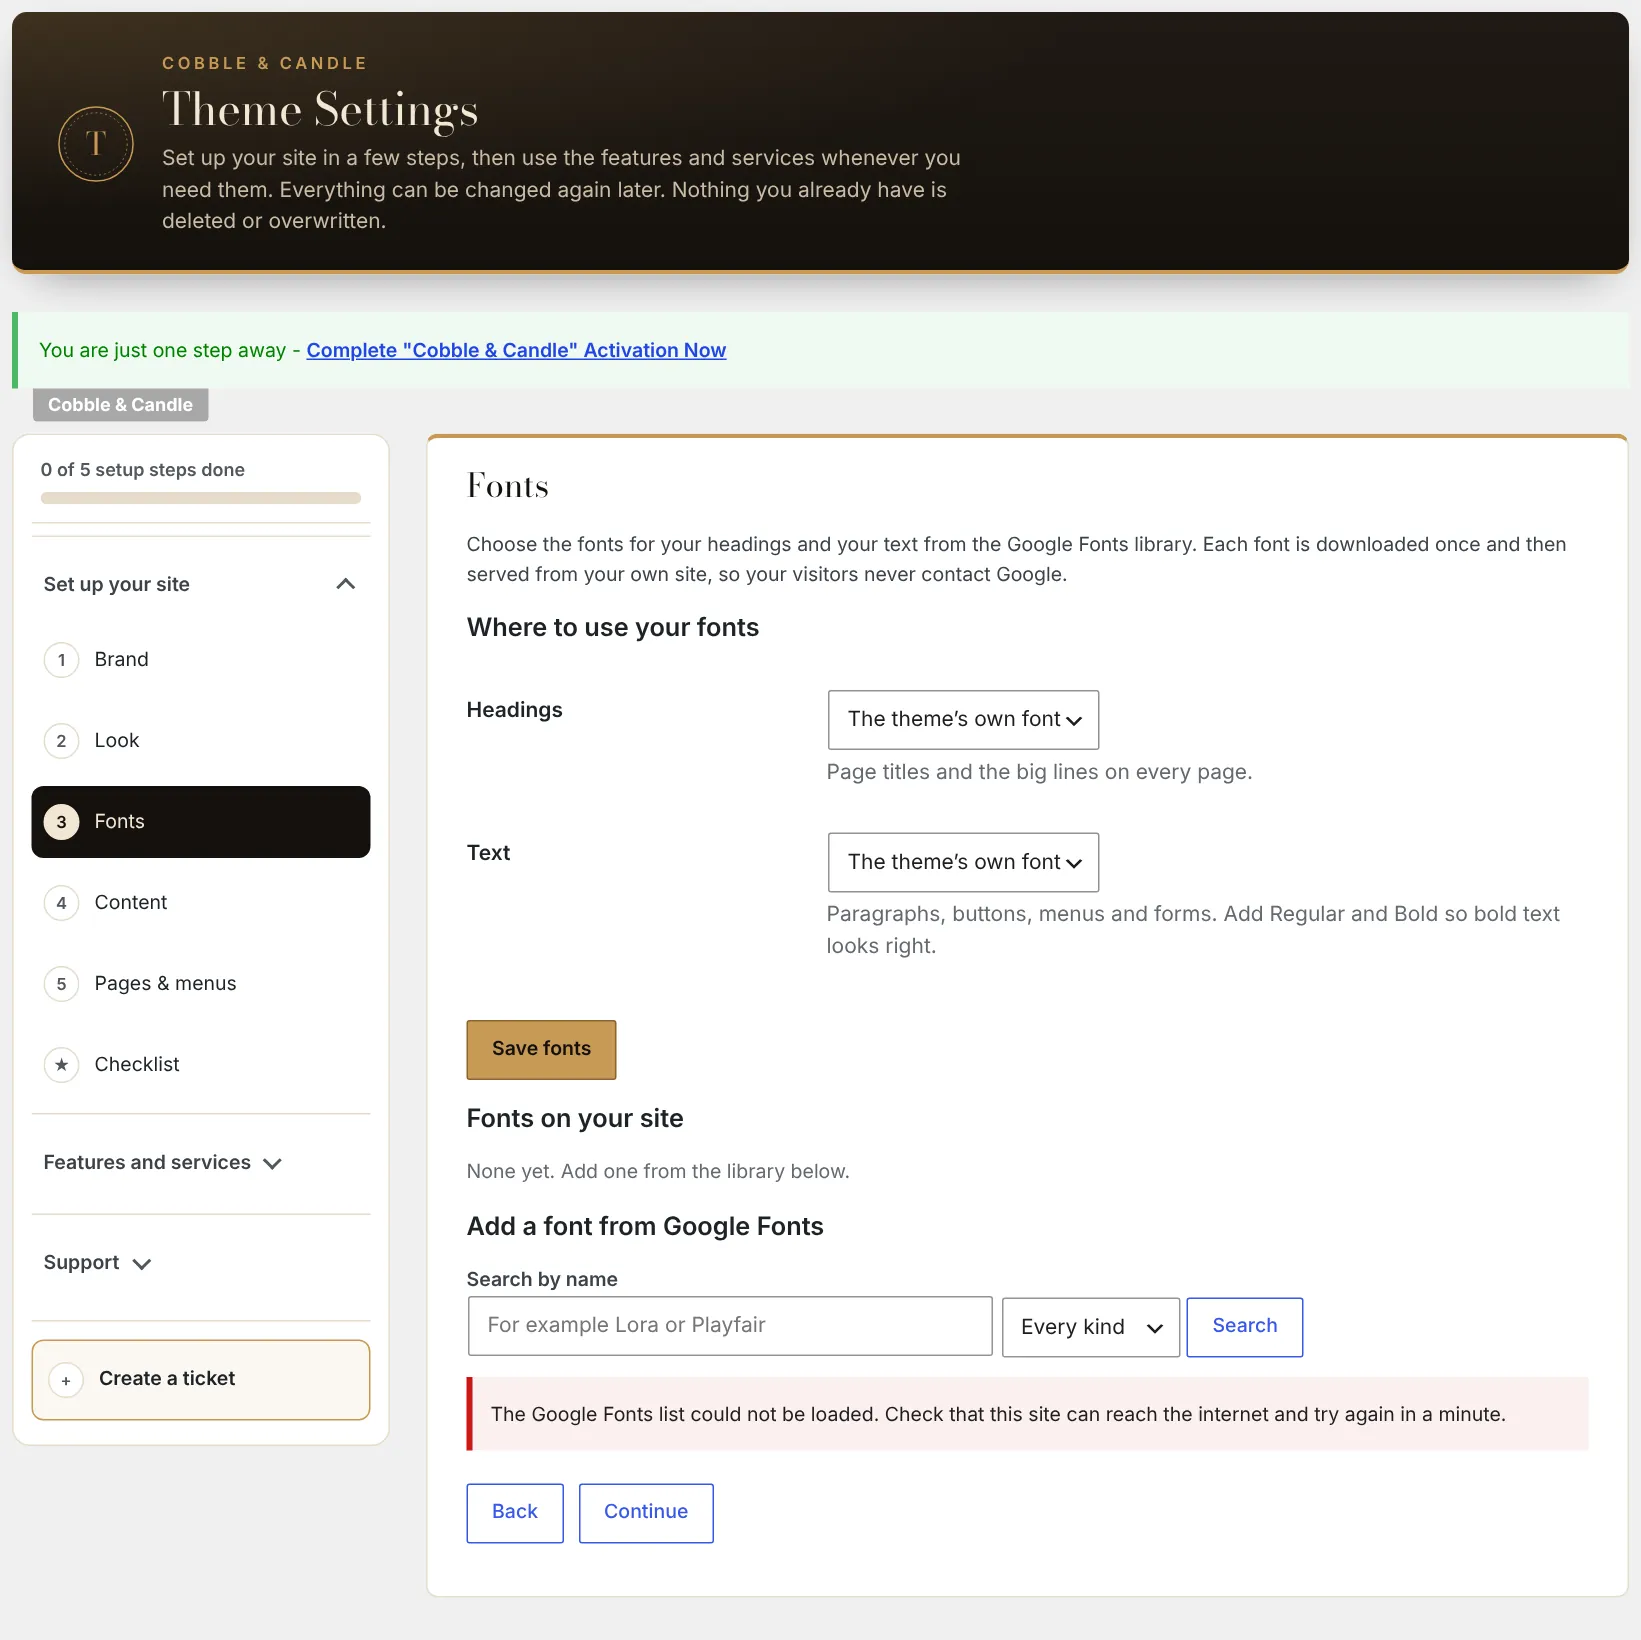
In Cobble & Candle, the Fonts screen lets an owner choose heading and body fonts. The theme serves fonts locally. If you’re checking a similar setup, open the browser’s Network panel, filter by Font and reload. Look at which files were requested, where they came from and whether the page needs every weight it loads. The Cobble & Candle setup guide shows where typography fits in the setup.
Run a before-and-after test
Use the printable checklist to record the page, the task you tried and what changed after each fix.
Download the free WordPress Speed Checklist (PDF)
- Open the menu from the homepage on a phone. Note what takes longest to appear and whether anything moves while you tap.
- Fix one likely cause on staging, such as an oversized menu photo or a third-party widget loading before the page needs it.
- Repeat the test under the same conditions. Check the menu, hours and reservation link before and after the change.
Where I’d start on a restaurant site
For a restaurant, I’d check the mobile menu, opening hours and the path to a reservation first. If those pages are fast but guests still struggle to find the right information, see my guide to restaurant website SEO. If a page still stalls, send me the URL and what you were trying to do.



Comments
No comments yet. ASCII, code, and plain punctuation are welcome.